> For the complete documentation index, see [llms.txt](https://docs.growthfactor.ai/llms.txt). Markdown versions of documentation pages are available by appending `.md` to page URLs; this page is available as [Markdown](https://docs.growthfactor.ai/data-and-analytics/available-listings.md).
# Available Listings
The **Available Listings** layer puts retail and land properties on the map. Each pin is a broker's listing, carrying the available space, asking rate, broker contact details, and a link back to the original listing. Off-market properties are included alongside publicly marketed ones.\
\
Listing data is updated weekly.
{% hint style="info" %}
**Closed Beta:** Available Listings is in closed beta for Labs and Enterprise customers.
{% endhint %}
***
### Turning the Layer On
{% columns %}
{% column valign="middle" %}
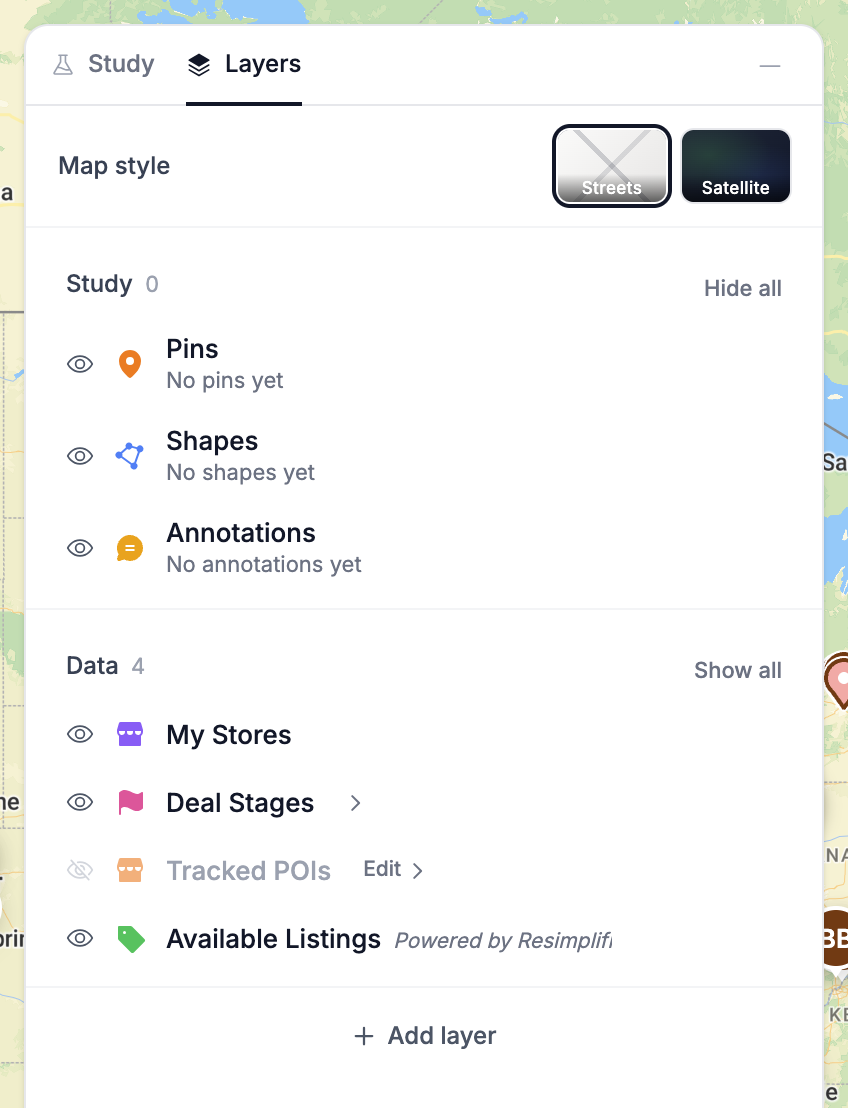
In a Market Planning study, open the **Layers** tab in the right panel and click **Add layer**. Pick **Available Listings** from the **Add a data layer** picker. Adding it to one study doesn't add it to your others.
The layer lands already visible, and appears under **Data** alongside your other layers.
{% endcolumn %}
{% column %}
{% endcolumn %}
{% endcolumns %}
On Site Analysis, click **Layers** in the top-right corner. **Available Listings** sits under the **Listings** category. It starts hidden, so click it to turn it on.
Listings only draw once you've zoomed in to roughly city level. If you are too zoomed out, you will see "Zoom in to see listings" under the Available Listings layer row.
### Reading the Map
Each pin tells you two things:
* **The icon** — the property type. A storefront for retail, a folded map for land.
* **The color** — the listing status.
| Color | Status |
| ------ | ------------------------------------- |
| Green | Active |
| Amber | Price reduced |
| Indigo | Pending |
| Gray | Leased, sold, off market, or inactive |
Gray pins are slighty faded so they aare distinguished from active inventory. The group covers a few different situations. Leased and sold listings have transacted, and they stay on the map as recent comparables. Off-market and inactive listings haven't. The property isn't being publicly marketed, but it may still be available, and the card carries the broker contact to ask.
Hover a pin to see the address and available size. Click it to open the full listing card.
### Filtering the Layer
Click **Filter listings** below the layer row to narrow what's on the map. A colored dot on the button means a filter is applied.
* **Property type** — **Retail** and **Land**. Click a pill to include or exclude that type.
* **Transaction** — **Lease** and **Sale**, the deal type the broker listed.
* **Status** — **Active**, **Price reduced**, and **Pending** each get their own checkbox. One **Sold, leased & off market** checkbox covers the gray statuses together, inactive included.
* **Available size (SF)** — set a **Min**, a **Max**, or both to show only listings whose available space overlaps that range. Land is measured in acres, so it's hidden while a size range is set.
**Reset** clears every filter and returns to the layer's default, which excludes sold, leased, off market, and inactive listings.
### The Listing Card
The card opens with the property type, the transaction type, and a status badge, followed by the address, the city and state, and the property subtype.
Below that, whichever of these the broker published:
* **Available SF** — the space available across the listing's suites. A single figure when there's one size, a range when suites differ, and `from 2,500 SF` or `up to 8,000 SF` when only one end of the range is published. Land listings show **Land Area** in acres instead.
* **Asking Rate** — the rate, with its basis. `$32.00/SF/yr` and `$1.85/SF/mo` are both common.
* **Price**
* **Year Built**
* **Last updated on** — the date the listing was last modified in the source feed.
Broker details follow: name and company, then email, mobile, and office number. Each contact is a link, and the button beside it copies the value to your clipboard.
Listing data is licensed from Resimplifi
***
---
# Agent Instructions
This documentation is published with GitBook. GitBook is the documentation platform designed so that both humans and AI agents can read, navigate, and reason over technical content effectively. Learn more at gitbook.com.
## Querying This Documentation
If you need additional information that is not directly available in this page, you can query the documentation dynamically by asking a question.
Perform an HTTP GET request on the current page URL with the `ask` query parameter, and the optional `goal` query parameter:
```
GET https://docs.growthfactor.ai/data-and-analytics/available-listings.md?ask=&goal=
```
`ask` is the immediate question: it should be specific, self-contained, and written in natural language.
`goal` is optional and describes the broader end goal you are ultimately trying to accomplish on behalf of the user. GitBook uses it to tailor the answer towards what is most useful for that goal.
The response will contain a direct answer to the question and relevant excerpts and sources from the documentation.
Use this mechanism when the answer is not explicitly present in the current page, you need clarification or additional context, or you want to retrieve related documentation sections.